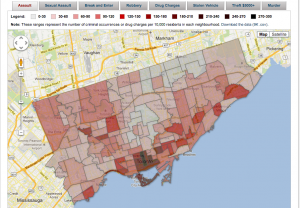
 Toronto home buyers want safe neighbourhoods, but what does a safe neighbourhood look like? How do you know what’s really going on behind closed doors?
The Toronto Police Services publicly shares this information (click here to access the interactive dashboard). It’s not for the faint of heart (and definitely not for my mother to see). It’s hard to believe what goes on right around us actually.
If you’re looking to get into Toronto’s real estate market and looking for a safe neighbourhood for your family, it’s better to be armed with the facts. So grab your cup of coffee, lock the doors, and check out the Top 10 Worst Toronto Neighbourhoods for Crime.
Worst Toronto Neighbourhoods for Crime – 2020
| Rank | Name | Assaults |
| 1 | Church-Yonge Corridor | 761 |
| 2 | Waterfront Communities – The Island | 757 |
| 3 | Moss Park | 756 |
| 4 | Bay Street Corridor | 516 |
| 5 | Kensington-Chinatown | 423 |
| 6 | Downsview Roding-CFB | 357 |
| 7 | Woburn | 348 |
| 8 | York University Heights | 341 |
| 9 | West Hill | 336 |
| 10 | Mimico (includes Humber Bay Shores) | 286 |
| Rank | Name | Shootings |
| 1 | Glenfield-Jane Heights | 34 |
| 2 | Black Creek | 18 |
| 3 | Mount Olive Silverstone-Jamestown | 16 |
| 4 | Woburn | 15 |
| 5 | Malvern | 15 |
| 6 | Yorkdale-Glen Park | 14 |
| 7 | Flemingdon Park | 13 |
| 8 | York University Heights | 12 |
| 9 | Eglinton East | 11 |
| 10 | Englemount-Lawrence | 11 |
| Rank | Name | Break & enters |
| 1 | Waterfront Communities-The Island | 351 |
| 2 | Church-Yonge Corridor | 241 |
| 3 | Bay Street Corridor | 227 |
| 4 | Annex | 203 |
| 5 | Moss Park | 201 |
| 6 | Kensington-Chinatown | 175 |
| 7 | Mount Pleasant West | 158 |
| 8 | Dovercourt-Wallace Emerson-Junction | 155 |
| 9 | South Riverdale | 142 |
| 10 | Niagara | 108 |
| Rank | Name | Robbery |
| 1 | Church-Yonge Corridor | 138 |
| 2 | Moss Park | 130 |
| 3 | Waterfront Communities-The Island | 83 |
| 4 | Bay Street Corridor | 82 |
| 5 | West Humber Clairville | 75 |
| 6 | Downsview-Roding-CBF | 55 |
| 7 | Woburn | 55 |
| 8 | Glenfield-Jane Heights | 49 |
| 9 | York University Heights | 47 |
| 10 | Annex | 44 |
| Rank | Name | Auto Theft |
| 1 | West Humber-Clairville | 396 |
| 2 | York University Heights | 184 |
| 3 | Downsview-Roding-CBF | 153 |
| 4 | Islington-City Centre West | 150 |
| 5 | Glenfield-Jane Heights | 124 |
| 6 | Humber Summit | 110 |
| 7 | Woburn | 96 |
| 8 | Wexford/Maryvale | 93 |
| 9 | Yorkdale-Glen Park | 87 |
| 10 | Mount Olive Silverstone-Jamestown | 85 |
| Rank | Name | Theft over $5000 |
| 1 | Waterfront Communities-The Island | 56 |
| 2 | West Humber-Clairville | 56 |
| 3 | Church-Yonge Corridor | 44 |
| 4 | Bay Street Corridor | 43 |
| 5 | York University Heights | 43 |
| 6 | Annex | 33 |
| 7 | Islington-City Centre West | 29 |
| 8 | Kensington-Chinatown | 27 |
| 9 | South Riverdale | 24 |
| 10 | Downsview-Roding-CBF | 23 |
I grew up in a town of 6,000 people where we didn’t lock our doors at night. Do I still feel safe in Toronto after looking up the stats in my own neighbourhood? I do. But I still lock the doors at night.
